March Nonresidential Construction Starts +60% M/M, but -8% Y/Y ‘ -20% YTD
Tough Competing with ‘Normal’ but 3 Mega Projects Helped ConstructConnect announced today that March 2021’s […]
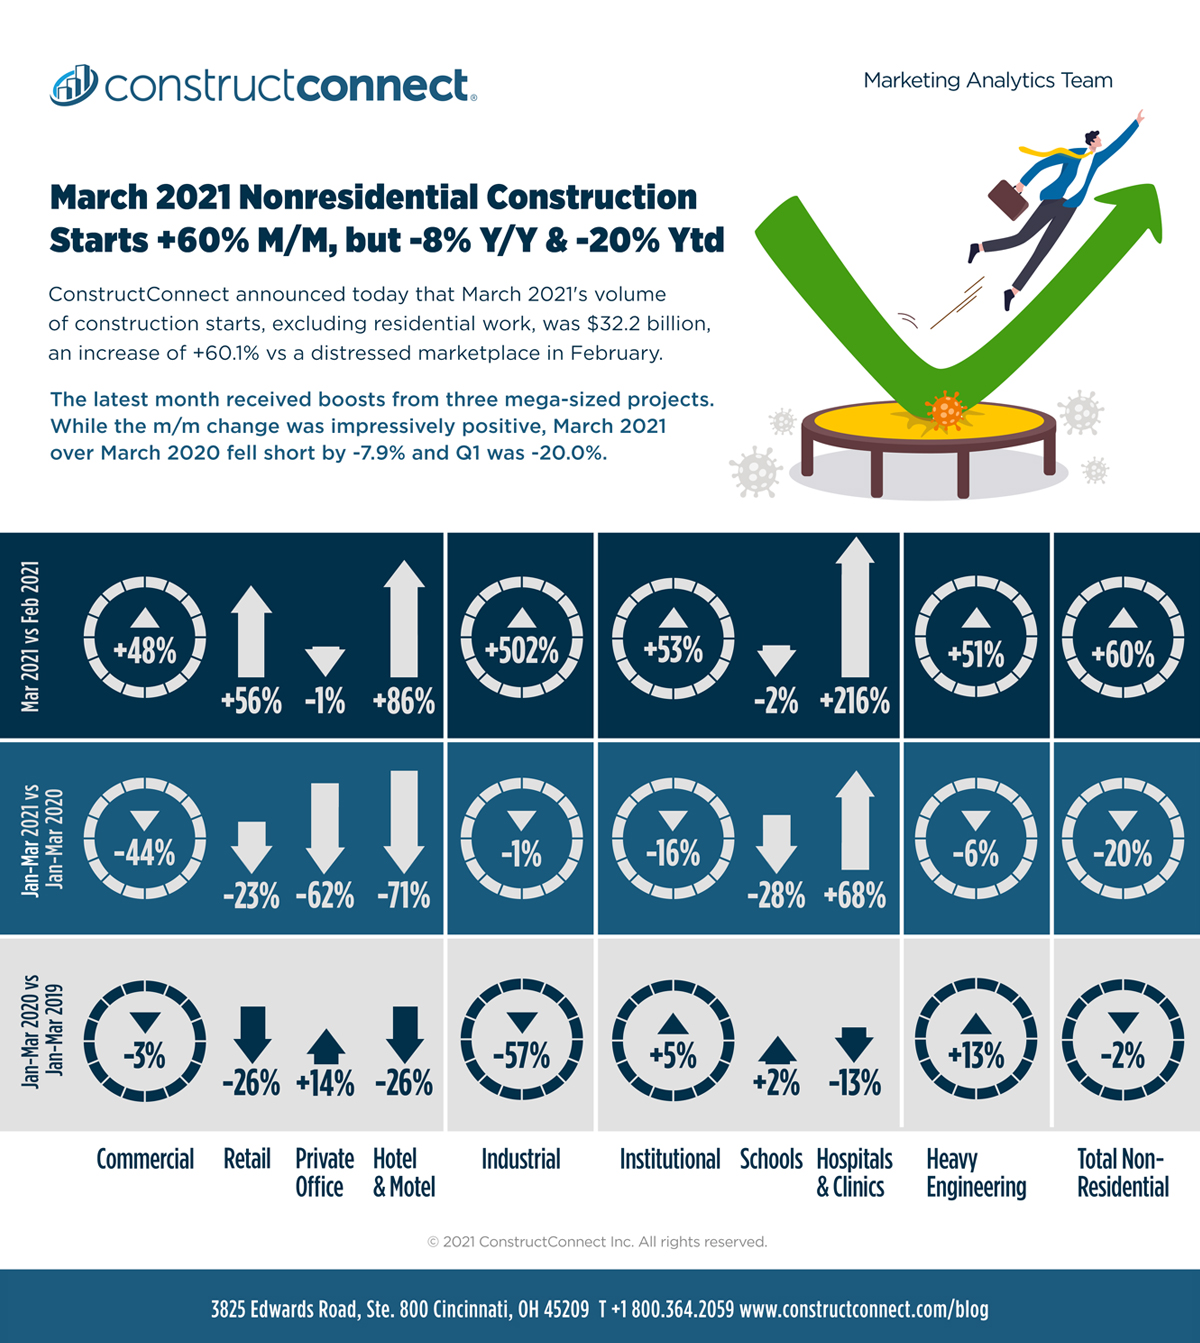
Tough Competing with ‘Normal’ but 3 Mega Projects Helped
ConstructConnect announced today that March 2021’s volume of construction starts, excluding residential work, was $32.2 billion, an increase of +60.1% versus February’s distressed level of only $20.1 billion
Total nonresidential (NR) groundbreakings in the latest month received boosts from three mega-sized projects, an auto plant expansion in Tennessee and two big hospital jobs located in Ohio and California (see Top 10 Project Starts in the U.S. – March 2021).
View this information as an infographic.
Click here to download the complete Construction Industry Snapshot Package – March 2021 PDF .
Leaving aside the exceptional weakness of total NR starts in the previous month (February), latest March’s starts volume failed to match year-ago March’s level, falling short by -7.9%.
Also, year-to-date starts through the first quarter of 2021 were off by one-fifth (-20.0%) relative to January-March 2020.
Keep in mind that Q1 of last year was mostly ‘normal’ with respect to a broad range of economic indicators, including ‘starts.’ The truly harmful effects caused by the outbreak of coronavirus infections occurred from the spring of 2020 on. Proceeding further into 2021, a ‘diminishing base (or denominator) effect’ will put a better polish on year-over-year comparisons.
The Starts Versus PIP Relationship
‘Starts’ compile the total estimated dollar value and square footage of all projects on which ground is broken in any given month. They lead, by nine months to as much as two years, put-in-place (PIP) statistics which are analogous to work-in-progress payments as the building of structures proceeds to completion.
PIP numbers cover the ‘universe’ of construction, new plus all manner of renovation activity, with residential traditionally making up two-fifths of the total and nonresidential, three-fifths (i.e., the bigger portion). Presently, though, according to the Census Bureau’s February 2021 PIP report for total U.S. construction spending, the mix has skewed more towards residential (47% of the total) and away from nonresidential (53%) than usual.
PIP numbers, being more spread out, have smaller peak-over-trough percent-change amplitudes than the ‘starts’ series. As an additional valuable service for clients and powered by its extensive ‘starts’ database, ConstructConnect, in partnership with Oxford Economics, a world leader in econometric model building, has developed put-in-place construction statistics by types of structure for U.S. states and cities, ‘actuals’ and forecasts.
Excellent Bounce Back for Construction Employment in March
The U.S. total jobs count was +916,000 in March and the construction sector played a major role in lifting that figure so high. The number of construction jobs in the latest month was +110,000. Graph 1 sets out the composition of the total gain, with nonresidential sub-trade contractors contributing the most, +38,000 jobs, followed by residential sub-trade contractors and engineering general contractors, tied at +27,000 each.
The construction sector’s not seasonally adjusted (NSA) unemployment rate improved by one full percentage point in March, moving down to 8.6% from 9.6% in February. The sector’s unemployment rate in March 2020 was 6.9%, but then it ballooned to 16.6% in April. Therefore, in a month from now, when a year-over-year comparison of unemployment rates is made, 2021’s result is going to appear outstanding next to 2020’s.
Construction’s -1.2% year-over-year performance in total employment is already looking pretty good relative to total jobs (-4.5%), private services-providing jobs (-4.6%), and manufacturing (-3.4%). Among industrial subsectors, only financial activities (-0.7%) and transportation and warehousing (-1.1%) are doing better, and only marginally. Those latter two corners of the economy are benefitting from a booming stock market and supercharged digital retail sales that require souped-up distribution channels.
The latest year-over-year payroll adjustments in some other pockets of the economy with close ties to construction have been: machinery and equipment rental and leasing, -13.6%; cement and concrete product manufacturing, -6.9%; oil and gas extraction, -1.4%; real estate, -1.0%; and architectural and engineering services, -0.3%. Again, though, many of those negative year-over-year percentage changes will lighten up next month. It should also be noted that building material and supplies retailers have maintained extraordinary staffing success, +8.1% y/y in the most recent period.
Federal Reserve Chairman, Jerome Powell, recently stated that the U.S. economy is at an ‘inflection point,’ preparing to soon display considerably stronger output growth, provided it is not derailed by further spiking waves of coronavirus infections.
For each month, ‘net’ = zero. ‘Sub-trade’ in BLS data referred to as ‘specialty’ trade.
The latest data points are for March, 2021.
A Good Month for Health Care & Commercial Subcategory Starts
In March 2021, total nonresidential starts were +60.1% compared with February (i.e., month to month). In percentage-change terms, the surge was led by industrial starts (+502.3%), with a big assist from General Motors (see Top 10 Project Starts in the U.S. – March 2021). The other three major type-of-structure subcategories, however, also chipped in with solid increases. Institutional (+53.4% m/m), engineering (+50.7%), and commercial (+47.9%) each recorded starts volume gains of approximately plus a half.
Year over year in the latest period (i.e., March 2021 vs March 2020), there was a relatively minor setback in total nonresidential starts (-7.9%) that was centered a little more in engineering work (-17.6%) than in institutional (-10.9%) and commercial (-10.3%). Industrial starts hoisted a sprightly banner on the plus side, +218.5% y/y.
On a year-to-date basis, at the end of Q1, (i.e., Jan-Mar 2021/Jan-Mar 2020) total NR starts fell by one-fifth (-20.0%), with most of the drag coming from commercial (-43.8%), although there was also weakness in institutional (-16.4%). Heavy engineering/civil came up a little short (-6.3%). Industrial’s starts volume stayed about even (-1.1%) with the first three months of last year.
Delving deeper into the type-of-structure sub-categories, the two that usually butt heads over which will account for the biggest share of total nonresidential starts are ‘school/college’ and ‘road/highway.’ Presently, their slices year to date are 14.4% and 15.4% respectively, summing to 29.8% (i.e. approaching one-third). The three metrics for educational facility starts in March were -2.2% m/m, -48.6% y/y, and -28.0% ytd. By comparison, road/highway starts were more buoyant, +52.6% m/m, although -2.8% y/y and -5.0% ytd.
Total health care facility starts in March – i.e., combining the categories ‘hospital/clinic’, ‘nursing/assisted living’ and ‘miscellaneous medical’ – were encouraging: +154.4% m/m; +83.7% y/y; and +3.3% ytd. Mega-sized hospital project initiations in Ohio and California helped (see Top 10 Project Starts in the U.S. – March 2021).
There were numerous surprisingly upbeat month-to-month percentage changes among commercial subcategories. Hotel/motel starts were +86.0% m/m; retail/shopping, +55.5%; amusement, +31.9%; and warehouse, +76.4%. In most instances, the large leaps were achieved over low base numbers in February. On a year-to-date basis, the starts volume changes for all of commercial’s subcategories came with negative signs.
Clearly, the new Biden Administration in Washington will be supporting electrification of the U.S. economy and it’s interesting to note, from Table 2, that starts on electric power infrastructure were +98.7% in this year’s Q1.
Table 2: Construction Starts in Some Additional Type of Structure Sub-Categories
| Jan-mar 2021 | % Change vs | |
| ($ billions) | Jan-mar 2020 | |
| Sports Stadiums/Convention Centers | $1.067 | -24.2% |
| Transportation Teminals | $0.172 | -73.2% |
| Courthouses | $0.645 | -9.0% |
| Police Stations & Fire Halls | $0.865 | -7.6% |
| Prisons | $0.407 | 4.7% |
| Pre-School/Elementary | $3.349 | -27.0% |
| Junior & Senior High Schools | $5.246 | -21.7% |
| K-12 (sum of above two categories) | $8.594 | -23.9% |
| Special & Vocational Schools | $0.277 | -32.8% |
| Colleges & Universities | $2.797 | -37.9% |
| Electric Power Infrastructure | $1.826 | 98.7% |
Data Source and Table: ConstructConnect.
JOLTS Data Speaks of Construction Employment Ambiguity
Besides the Employment Situation report, the BLS also publishes a monthly JOLTS summary, where JOLTS is an acronym for Job Openings and Labor Turnover Survey. JOLTS data on construction employment introduces some ambiguity concerning March’s jump of +110,000 on-site jobs featured in the more-heavily touted BLS release.
Graph 5 shows construction job ‘openings’ which, as both a level and rate, have moderated from their peaks in 2019, but are still quite high. They remain above earlier local peaks in 2007 and 2001. ‘Hirings’ in Graph 6, though, after displaying an extreme amplitude in the Spring of last year, first going into a deep dive then rebounding mightily, have now settled into territory that is a little above average as a level, but is depressed as a rate.
More context should be provided concerning the latest month’s +110,000 increase in construction jobs found in the Employment Situation report. It came on the heels of a -56,000 jobs performance in February. Seemingly, more time will be needed to determine if construction employment is on a true upswing, as indicated by March’s number, or is rather in a bouncing up and down phase.
*Rate is number of job openings end-of-month as % of ‘construction employment plus number of job openings’.
Latest seasonally adjusted data points are for Feb. 2021. … JOLTS = Job Openings and Labor Turnover Survey.
Some Exceptions to Starts Trend Line Descents
Most of the curves among the half dozen 12-month moving average trend graphs (Nonresidential Construction Starts Trend Graphs – March 2021) still display the downward slopes that have been their main characteristic over the past year or so.
But there are a few exceptions. A minor uptick has just appeared in the trend line for hospitals/clinics. The graphs for roads/highways and water/sewage have stayed somewhat elevated and level through the pandemic hard times of the past year. Finally, miscellaneous civil has flattened out over the latest four months.
Construction Workers Not in Pay Hike Vanguard
Tables B-3 and B-8 of the monthly Employment Situation report record average hourly and average weekly wages for industry sectors. B-3 is for all employees (i.e., including bosses) on nonfarm payrolls. B-8 is for ‘production and nonsupervisory personnel’ only (i.e., it excludes bosses). For ‘all jobs’ and construction, there are eight relevant percentage changes to consider.
From Table B-3 (including bosses), ‘all jobs’ earnings y/y in March 2021 were +4.2% hourly and +6.7% weekly. For construction workers, as a subset of ‘all jobs,’ the pay hikes were less spectacular, +2.5% hourly and +3.8% weekly. From Table B-8 (excluding supervisors), ‘all jobs’ compensation increases in the latest month were +4.4% hourly and +7.2% weekly. Again, construction workers, at +2.4% hourly and +4.0% weekly, weren’t in the vanguard.
Table 3: Q1 2021 Ranking of Top 20 States by YTD $ Volume of Nonresidential Construction Starts – ConstructConnect
| Jan-MAR 2021 | % Change vs Jan-MAR 2020 | ||
| 1 | Texas | $10,416,889,209 | -2.0% |
| 2 | California | $7,997,893,211 | -23.3% |
| 3 | Florida | $4,816,921,643 | -25.5% |
| 4 | Ohio | $4,126,854,473 | 49.4% |
| 5 | New York | $3,640,503,569 | -36.1% |
| 6 | Tennessee | $3,636,358,370 | 36.7% |
| 7 | Georgia | $3,388,558,746 | -8.9% |
| 8 | Minnesota | $3,353,798,791 | 96.5% |
| 9 | Illinois | $2,571,915,181 | -11.5% |
| 10 | Pennsylvania | $2,485,456,139 | -6.6% |
| 11 | North Carolina | $2,389,468,122 | -0.9% |
| 12 | Virginia | $2,283,192,217 | -36.9% |
| 13 | Michigan | $1,830,456,583 | 7.2% |
| 14 | Missouri | $1,782,954,148 | -23.4% |
| 15 | Washington | $1,588,773,234 | -42.9% |
| 16 | South Carolina | $1,547,145,327 | 13.1% |
| 17 | Indiana | $1,529,848,681 | -27.4% |
| 18 | Massachusetts | $1,425,066,119 | -31.2% |
| 19 | Colorado | $1,352,366,466 | -36.8% |
| 20 | Maine | $1,335,723,456 | 234.2% |
Figures are comprised of non-res building & engineering (residential is omitted).
Data Source and Table: ConstructConnect.
Table 4: Q1 2021 Ranking of Top 20 States by YTD $ Volume of Nonresidential Building Construction Starts – ConstructConnect
| Jan-MAR 2021 | % Change vs Jan-MAR 2020 | ||
| 1 | Texas | $6,159,640,331 | -8.5% |
| 2 | California | $4,894,692,090 | -13.4% |
| 3 | Ohio | $3,240,749,314 | 92.8% |
| 4 | Tennessee | $3,237,551,653 | 58.8% |
| 5 | Florida | $2,881,550,435 | -37.1% |
| 6 | Georgia | $2,399,707,139 | -2.9% |
| 7 | New York | $2,080,171,700 | -48.4% |
| 8 | Pennsylvania | $1,801,892,186 | 34.1% |
| 9 | North Carolina | $1,781,061,878 | -2.2% |
| 10 | Virginia | $1,700,154,832 | -34.2% |
| 11 | Illinois | $1,477,020,024 | -6.2% |
| 12 | Missouri | $1,294,058,120 | -23.4% |
| 13 | South Carolina | $1,021,101,274 | 12.4% |
| 14 | Massachusetts | $1,019,799,540 | -36.1% |
| 15 | Washington | $974,440,958 | -48.9% |
| 16 | Michigan | $934,767,879 | -18.7% |
| 17 | Alabama | $909,397,173 | -27.0% |
| 18 | Colorado | $825,775,610 | -49.0% |
| 19 | Arizona | $769,551,060 | -77.1% |
| 20 | Utah | $636,171,666 | -54.2% |
Data Source and Table: ConstructConnect.
Table 5: Q1 2021 Ranking of Top 20 States by YTD $ Volume of Heavy/Engineering Civil Construction Starts – ConstructConnect
| Jan-MAR 2021 | % Change vs Jan-mar 2020 | ||
| 1 | Texas | $4,257,248,878 | 9.1% |
| 2 | California | $3,103,201,121 | -35.0% |
| 3 | Minnesota | $2,952,908,765 | 213.0% |
| 4 | Florida | $1,935,371,208 | 2.3% |
| 5 | New York | $1,560,331,869 | -6.2% |
| 6 | Maine | $1,190,501,608 | 274.9% |
| 7 | Illinois | $1,094,895,157 | -17.7% |
| 8 | Georgia | $988,851,607 | -20.7% |
| 9 | Indiana | $949,087,190 | 4.5% |
| 10 | Michigan | $895,688,704 | 60.8% |
| 11 | Ohio | $886,105,159 | -18.1% |
| 12 | Wisconsin | $811,706,231 | 31.1% |
| 13 | Pennsylvania | $683,563,953 | -48.1% |
| 14 | Washington | $614,332,276 | -29.7% |
| 15 | North Carolina | $608,406,244 | 3.2% |
| 16 | Oklahoma | $585,677,254 | 69.0% |
| 17 | Virginia | $583,037,385 | -43.6% |
| 18 | Colorado | $526,590,856 | 1.1% |
| 19 | South Carolina | $526,044,053 | 14.7% |
| 20 | Missouri | $488,896,028 | -23.5% |
Data Source and Table: ConstructConnect.
Building Material Costs have been Skyrocketing
March 2021’s y/y results for three structures-related BLS Producer Price Index (PPI) series were as follows: ‘construction materials special index,’ +16.6% (a significant step up from February’s already eye-catching +12.4%); ‘inputs to new construction index, excluding capital investment, labor, and imports,’ +13.5% (a further acceleration from February’s +10.0%); and ‘final demand construction,’ +1.5% (higher than the previous month’s +1.0%, but still restrained). Material input costs have been soaring, but contractors have not been raising their bid prices in like fashion. In the interest of winning work, they’ve largely been ‘eating’ their extra expenses.
What are some of the major material cost climbs that have been occurring? On a y/y basis, according to latest PPI results, softwood lumber is +83.4%; unleaded regular gasoline, +57.0%; copper wire and cable, +26.7%; and hot rolled steel bars, plates and structural shapes, +20.3%. Quieter on the cost front, or at least recording single-digit y/y percentage increases, have been asphalt, +9.0%; aluminum sheet and strip, +5.7%; gypsum products, +6.2%; and cement, +3.4%.
The value of construction starts each month is derived from ConstructConnect’s database of all active construction projects in the United States. Missing project values are estimated with the help of RSMeans’ building cost models. ConstructConnect’s nonresidential construction starts series, because it is comprised of total-value estimates for individual projects, some of which are super-large, has a history of being more volatile than many other leading indicators for the economy.
2021’s Q1 ‘Grand Total’ Starts -12.4% Ytd
From Table 8 below, ConstructConnect’s total residential starts in March 2021 were +7.4% m/m and +2.3% y/y, but -1.2% ytd. Multi-family starts have languished while singles have taken wing. The latest month’s multi-unit starts were -17.6% m/m, -24.1% y/y, and -21.7% ytd. But single-family starts in March 2021 were +17.5% m/m, +13.5% y/y, and +7.7% ytd. Including home building with all nonresidential categories, ConstructConnect’s ‘Grand Total’ starts in 2021’s third month were +32.3% m/m, but -3.8% y/y and -12.4% ytd.
ConstructConnect adopts a research-assigned ‘start’ date. In concept, a ‘start’ is equivalent to ground being broken for a project to proceed. If work is abandoned or re-bid, the ‘start’ date is revised to reflect the new information.
Expansion Index Monitors Construction Prospects
The economy may be in recovery mode, but nonresidential work is usually a lagging player. Companies are hesitant to undertake capital spending until their personnel needs are rapidly expanding and their office square footage or plant footprints are straining capacity. Also, it helps if profits are abundant. (Today’s greater tendency to work from home has made office occupancy much more difficult to assess.)
Each month, ConstructConnect publishes information on upcoming construction projects on its Expansion Index page.
The Expansion Index, for hundreds of cities in the U.S. and Canada, calculates the ratio, based on dollar volume, of projects in the planning stage, at present, divided by the comparable figure a year ago. The ratio moves above 1.0 when there is currently a larger dollar volume of construction ‘prospects’ than there was last year at the same time. The ratio sinks below 1.0 when the opposite is the case. The results are set out in interactive maps for both countries.
Click here to download the Construction Industry Snapshot Package – March 2021 PDF.
Click here for the Top 10 Project Starts in the U.S. – March 2021.
Click here for the Nonresidential Construction Starts Trend Graphs – March 2021.
TABLE 6: VALUE OF UNITED STATES NONRESIDENTIAL CONSTRUCTION STARTS
MARCH 2021 – CONSTRUCTCONNECT
| % Change | % Change | % Change | ||||
| Jan-MAR 21 | Jan-MAR 21 vs | MAR 21 vs | MAR 21 vs | |||
| ($ billions) | Jan-MAR 20 | MAR 20 | FEB 21 | |||
| Hotel/Motel | 1.310 | -71.2% | -46.5% | 86.0% | ||
| Retail | 2.569 | -23.1% | -17.6% | 55.5% | ||
| Parking Garage | 0.566 | -4.2% | -31.2% | -59.4% | ||
| Amusement | 1.515 | -19.5% | 2.1% | 31.9% | ||
| Private Office | 2.902 | -61.7% | -39.1% | -1.4% | ||
| Government Office | 2.172 | -12.7% | -11.8% | 14.0% | ||
| Laboratory | 0.373 | -52.2% | 0.1% | 64.3% | ||
| Warehouse | 3.943 | -36.9% | 30.3% | 76.4% | ||
| Miscellaneous Commercial* | 1.239 | -39.6% | 17.8% | 297.0% | ||
| COMMERCIAL (big subset) | 16.590 | -43.8% | -10.3% | 47.9% | ||
| INDUSTRIAL (Manufacturing) | 4.884 | -1.1% | 218.5% | 502.3% | ||
| Religious | 0.185 | -64.9% | -64.7% | 89.2% | ||
| Hospital/Clinic | 5.580 | 67.7% | 480.3% | 216.3% | ||
| Nursing/Assisted Living | 0.946 | -52.5% | -34.6% | 263.1% | ||
| Library/Museum | 0.510 | -69.8% | -15.0% | 91.2% | ||
| Police/Courthouse/Prison | 1.917 | -5.8% | -23.0% | 4.0% | ||
| Military | 2.575 | 73.8% | 121.5% | 191.0% | ||
| School/College | 11.669 | -28.0% | -48.6% | -2.2% | ||
| Miscellaneous Medical | 1.287 | -42.8% | -65.8% | -17.1% | ||
| INSTITUTIONAL | 24.669 | -16.4% | -10.9% | 53.4% | ||
| Miscellaneous Nonresidential | 1.287 | -14.5% | -17.7% | -9.1% | ||
| NONRESIDENTIAL BUILDING | 47.430 | -27.5% | -1.0% | 66.2% | ||
| Airport | 0.485 | -47.9% | -68.9% | 2.1% | ||
| Road/Highway | 12.502 | -5.0% | -2.8% | 52.6% | ||
| Bridge | 4.916 | -30.0% | -39.3% | 59.1% | ||
| Dam/Marine | 1.382 | -26.7% | -17.8% | 25.5% | ||
| Water/Sewage | 7.774 | 6.3% | -13.6% | 37.6% | ||
| Miscellaneous Civil (power, pipelines, etc.) | 6.652 | 17.1% | -19.6% | 93.1% | ||
| HEAVY ENGINEERING (Civil) | 33.711 | -6.3% | -17.6% | 50.7% | ||
| TOTAL NONRESIDENTIAL | 81.141 | -20.0% | -7.9% | 60.1% |
*Includes transportation terminals and sports arenas.
Source: ConstructConnect Research Group and ConstructConnect.
Table: ConstructConnect.
TABLE 7: VALUE OF UNITED STATES CONSTRUCTION STARTS
CONSTRUCTCONNECT INSIGHT VERSION – MARCH 2021
Arranged to match the alphabetical category drop-down menus in INSIGHT
| % Change | % Change | % Change | ||||||
| Jan-Mar 21 | Jan-Mar 21 vs | Mar 21 vs | Mar 21 vs | |||||
| ($ billions) | Jan-Mar 20 | Mar 20 | Feb 21 | |||||
| Summary | ||||||||
| CIVIL | 33.711 | -6.3% | -17.6% | 50.7% | ||||
| NONRESIDENTIAL BUILDING | 47.430 | -27.5% | -1.0% | 66.2% | ||||
| RESIDENTIAL | 68.164 | -1.2% | 2.3% | 7.4% | ||||
| GRAND TOTAL | 149.305 | -12.4% | -3.8% | 32.3% | ||||
| Verticals | ||||||||
| Airport | 0.485 | -47.9% | -68.9% | 2.1% | ||||
| All Other Civil | 4.826 | 1.3% | -15.8% | 79.3% | ||||
| Bridges | 4.916 | -30.0% | -39.3% | 59.1% | ||||
| Dams / Canals / Marine Work | 1.382 | -26.7% | -17.8% | 25.5% | ||||
| Power Infrastructure | 1.826 | 98.7% | -25.7% | 125.1% | ||||
| Roads | 12.502 | -5.0% | -2.8% | 52.6% | ||||
| Water and Sewage Treatment | 7.774 | 6.3% | -13.6% | 37.6% | ||||
| CIVIL | 33.711 | -6.3% | -17.6% | 50.7% | ||||
| Offices (private) | 2.902 | -61.7% | -39.1% | -1.4% | ||||
| Parking Garages | 0.566 | -4.2% | -31.2% | -59.4% | ||||
| Transportation Terminals | 0.172 | -73.2% | -77.7% | -39.8% | ||||
| Commercial (small subset) | 3.640 | -58.7% | -43.3% | -16.7% | ||||
| Amusement | 1.515 | -19.5% | 2.1% | 31.9% | ||||
| Libraries / Museums | 0.510 | -69.8% | -15.0% | 91.2% | ||||
| Religious | 0.185 | -64.9% | -64.7% | 89.2% | ||||
| Sports Arenas / Convention Centers | 1.067 | -24.2% | 61.3% | 512.1% | ||||
| Community | 3.277 | -40.5% | 4.5% | 119.3% | ||||
| College / University | 2.797 | -37.9% | -59.4% | -17.5% | ||||
| Elementary / Pre School | 3.349 | -27.0% | -48.5% | 40.8% | ||||
| Jr / Sr High School | 5.246 | -21.7% | -41.8% | -13.1% | ||||
| Special / Vocational | 0.277 | -32.8% | -58.9% | -28.0% | ||||
| Educational | 11.669 | -28.0% | -48.6% | -2.2% | ||||
| Courthouses | 0.645 | -9.0% | -30.7% | -39.9% | ||||
| Fire and Police Stations | 0.865 | -7.6% | 4.3% | 24.4% | ||||
| Government Offices | 2.172 | -12.7% | -11.8% | 14.0% | ||||
| Prisons | 0.407 | 4.7% | -53.3% | 58.3% | ||||
| Government | 4.089 | -9.6% | -16.4% | 9.9% | ||||
| Industrial Labs / Labs / School Labs | 0.373 | -52.2% | 0.1% | 64.3% | ||||
| Manufacturing | 4.884 | -1.1% | 218.5% | 502.3% | ||||
| Warehouses | 3.943 | -36.9% | 30.3% | 76.4% | ||||
| Industrial | 9.200 | -23.1% | 94.1% | 196.1% | ||||
| Hospitals / Clinics | 5.580 | 67.7% | 480.3% | 216.3% | ||||
| Medical Misc. | 1.287 | -42.8% | -65.8% | -17.1% | ||||
| Nursing Homes | 0.946 | -52.5% | -34.6% | 263.1% | ||||
| Medical | 7.813 | 3.3% | 83.7% | 154.4% | ||||
| Military | 2.575 | 73.8% | 121.5% | 191.0% | ||||
| Hotels | 1.310 | -71.2% | -46.5% | 86.0% | ||||
| Retail Misc. | 1.287 | -14.5% | -17.7% | -9.1% | ||||
| Shopping | 2.569 | -23.1% | -17.6% | 55.5% | ||||
| Retail | 5.166 | -45.0% | -28.0% | 40.7% | ||||
| NONRESIDENTIAL BUILDING | 47.430 | -27.5% | -1.0% | 66.2% | ||||
| Multi-Family | 16.373 | -21.7% | -24.1% | -17.6% | ||||
| Single-Family | 51.791 | 7.7% | 13.5% | 17.5% | ||||
| RESIDENTIAL | 68.164 | -1.2% | 2.3% | 7.4% | ||||
| NONRESIDENTIAL | 81.141 | -20.0% | -7.9% | 60.1% | ||||
| GRAND TOTAL | 149.305 | -12.4% | -3.8% | 32.3% | ||||
Table 2 conforms to the type-of-structure ordering adopted by many firms and organizations in the industry. Specifically, it breaks nonresidential building into ICI work (i.e., industrial, commercial, and institutional), since each has its own set of economic and demographic drivers. Table 3 presents an alternative, perhaps more user-friendly and intuitive type-of-structure ordering that matches how the data appears in ConstructConnect Insight.
Source: ConstructConnect.
Table: ConstructConnect.
TABLE 8: VALUE OF UNITED STATES NATIONAL CONSTRUCTION STARTS – MARCH 2021 – CONSTRUCTCONNECT
Billions of current $s, not seasonally adjusted (NSA)
| Latest month actuals | Moving averages (placed in end month) | Year to Date. | |||||||||
| 3-months | 12-months | JAN-mar | JAN-mar | ||||||||
| jan 21 | feb 21 | mar 21 | jan 21 | feb 21 | mar 21 | jan 21 | feb 21 | mar 21 | 2020 | 2021 | |
| Single Family | 17.026 | 15.983 | 18.782 | 18.754 | 17.624 | 17.264 | 18.435 | 18.406 | 18.593 | 48.071 | 51.791 |
| month-over-month % change | -14.3% | -6.1% | 17.5% | -8.5% | -6.0% | -2.0% | 0.8% | -0.2% | 1.0% | ||
| year-over-year % change | 12.0% | -2.1% | 13.5% | 22.2% | 12.3% | 7.7% | 11.2% | 9.1% | 9.9% | 9.4% | 7.7% |
| Apartment | 4.567 | 6.472 | 5.333 | 5.225 | 5.231 | 5.458 | 6.202 | 6.200 | 6.060 | 20.921 | 16.373 |
| month-over-month % change | -1.9% | 41.7% | -17.6% | -13.9% | 0.1% | 4.3% | -3.7% | 0.0% | -2.3% | ||
| year-over-year % change | -38.4% | -0.2% | -24.1% | -38.3% | -30.4% | -21.7% | -25.2% | -24.3% | -25.5% | -6.3% | -21.7% |
| TOTAL RESIDENTIAL | 21.593 | 22.456 | 24.115 | 23.979 | 22.856 | 22.721 | 24.637 | 24.607 | 24.652 | 68.992 | 68.164 |
| month-over-month % change | -11.9% | 4.0% | 7.4% | -9.7% | -4.7% | -0.6% | -0.3% | -0.1% | 0.2% | ||
| year-over-year % change | -4.5% | -1.6% | 2.3% | 0.7% | -1.6% | -1.2% | -0.9% | -1.8% | -1.6% | 4.1% | -1.2% |
| Hotel/Motel | 0.481 | 0.290 | 0.539 | 0.574 | 0.332 | 0.437 | 0.762 | 0.619 | 0.579 | 4.544 | 1.310 |
| month-over-month % change | 112.8% | -39.7% | 86.0% | -8.0% | -42.1% | 31.4% | -10.3% | -18.8% | -6.3% | ||
| year-over-year % change | -68.5% | -85.6% | -46.5% | -73.1% | -82.1% | -71.2% | -61.1% | -68.7% | -68.3% | -26.0% | -71.2% |
| Retail | 0.823 | 0.683 | 1.063 | 0.779 | 0.701 | 0.856 | 0.964 | 0.951 | 0.932 | 3.339 | 2.569 |
| month-over-month % change | 38.0% | -16.9% | 55.5% | -10.1% | -10.0% | 22.2% | -3.2% | -1.4% | -2.0% | ||
| year-over-year % change | -31.5% | -19.4% | -17.6% | -31.1% | -29.6% | -23.1% | -29.3% | -26.0% | -27.1% | -26.0% | -23.1% |
| Parking Garages | 0.229 | 0.240 | 0.097 | 0.132 | 0.182 | 0.189 | 0.133 | 0.147 | 0.143 | 0.591 | 0.566 |
| month-over-month % change | 191.0% | 4.9% | -59.4% | 28.6% | 37.6% | 3.4% | -8.4% | 10.4% | -2.5% | ||
| year-over-year % change | -39.0% | 222.7% | -31.2% | -49.0% | -4.8% | -4.2% | -50.5% | -44.8% | -42.2% | -24.7% | -4.2% |
| Amusement | 0.416 | 0.474 | 0.625 | 0.394 | 0.432 | 0.505 | 0.497 | 0.492 | 0.494 | 1.882 | 1.515 |
| month-over-month % change | 2.3% | 13.9% | 31.9% | -22.6% | 9.7% | 16.8% | -5.1% | -1.0% | 0.2% | ||
| year-over-year % change | -43.5% | -11.2% | 2.1% | -34.8% | -32.2% | -19.5% | -23.0% | -25.0% | -25.0% | 19.3% | -19.5% |
| Office | 1.342 | 0.786 | 0.775 | 2.141 | 1.220 | 0.967 | 1.866 | 1.644 | 1.602 | 7.576 | 2.902 |
| month-over-month % change | -12.4% | -41.5% | -1.4% | -2.8% | -43.0% | -20.7% | -6.3% | -11.9% | -2.5% | ||
| year-over-year % change | -53.0% | -77.2% | -39.1% | -36.5% | -55.8% | -61.7% | -41.6% | -51.6% | -48.7% | 13.6% | -61.7% |
| Governmental Offices | 0.645 | 0.714 | 0.813 | 0.725 | 0.703 | 0.724 | 0.887 | 0.881 | 0.872 | 2.488 | 2.172 |
| month-over-month % change | -14.0% | 10.7% | 14.0% | -2.4% | -3.1% | 3.0% | -1.3% | -0.7% | -1.0% | ||
| year-over-year % change | -17.4% | -9.2% | -11.8% | -17.4% | -9.4% | -12.7% | -9.9% | -11.4% | -14.1% | 20.9% | -12.7% |
| Laboratories | 0.075 | 0.113 | 0.186 | 0.152 | 0.141 | 0.124 | 0.161 | 0.158 | 0.158 | 0.781 | 0.373 |
| month-over-month % change | -68.4% | 51.0% | 64.3% | -26.5% | -6.9% | -12.0% | -16.2% | -1.8% | 0.0% | ||
| year-over-year % change | -83.3% | -23.5% | 0.1% | -51.5% | -53.1% | -52.2% | -27.6% | -30.8% | -29.6% | 54.5% | -52.2% |
| Warehouse | 0.982 | 1.072 | 1.890 | 1.393 | 1.011 | 1.314 | 1.866 | 1.837 | 1.874 | 6.247 | 3.943 |
| month-over-month % change | 0.3% | 9.2% | 76.4% | -22.9% | -27.4% | 30.1% | -9.7% | -1.5% | 2.0% | ||
| year-over-year % change | -71.0% | -24.3% | 30.3% | -44.8% | -56.2% | -36.9% | -8.7% | -10.4% | -8.8% | 50.3% | -36.9% |
| Misc Commercial | 0.285 | 0.192 | 0.762 | 0.281 | 0.210 | 0.413 | 0.527 | 0.492 | 0.502 | 2.050 | 1.239 |
| month-over-month % change | 87.9% | -32.6% | 297.0% | -4.4% | -25.5% | 97.1% | -7.4% | -6.6% | 2.0% | ||
| year-over-year % change | -64.1% | -68.5% | 17.8% | -74.0% | -72.4% | -39.6% | -67.6% | -69.7% | -67.9% | -47.2% | -39.6% |
| TOTAL COMMERCIAL | 5.277 | 4.563 | 6.750 | 6.571 | 4.932 | 5.530 | 7.664 | 7.221 | 7.156 | 29.497 | 16.590 |
| month-over-month % change | 6.5% | -13.5% | 47.9% | -10.7% | -25.0% | 12.1% | -6.9% | -5.8% | -0.9% | ||
| year-over-year % change | -56.4% | -53.8% | -10.3% | -46.6% | -53.4% | -43.8% | -37.7% | -42.1% | -40.3% | -2.6% | -43.8% |
| TOTAL INDUSTRIAL (Manufacturing) | 1.601 | 0.467 | 2.815 | 0.968 | 0.866 | 1.628 | 1.700 | 1.524 | 1.685 | 4.938 | 4.884 |
| month-over-month % change | 202.5% | -70.8% | 502.3% | -27.2% | -10.5% | 88.0% | 0.6% | -10.3% | 10.6% | ||
| year-over-year % change | 8.4% | -81.9% | 218.5% | -51.4% | -54.3% | -1.1% | -62.3% | -66.1% | -59.0% | -56.7% | -1.1% |
| Religious | 0.037 | 0.051 | 0.097 | 0.096 | 0.087 | 0.062 | 0.119 | 0.114 | 0.099 | 0.526 | 0.185 |
| month-over-month % change | -78.7% | 39.7% | 89.2% | -24.1% | -9.6% | -28.8% | -6.7% | -4.3% | -13.1% | ||
| year-over-year % change | -73.5% | -54.6% | -64.7% | -38.9% | -28.6% | -64.9% | -21.9% | -25.7% | -39.2% | 12.7% | -64.9% |
| Hosptials/Clinics | 0.742 | 1.162 | 3.676 | 1.024 | 0.857 | 1.860 | 1.025 | 0.999 | 1.253 | 3.327 | 5.580 |
| month-over-month % change | 11.6% | 56.6% | 216.3% | -12.9% | -16.4% | 117.1% | -3.7% | -2.5% | 25.4% | ||
| year-over-year % change | -39.1% | -21.2% | 480.3% | -48.6% | -47.5% | 67.7% | -42.7% | -46.1% | -29.4% | -13.2% | 67.7% |
| Nursing/Assisted Living | 0.428 | 0.112 | 0.406 | 0.507 | 0.347 | 0.315 | 0.569 | 0.529 | 0.511 | 1.991 | 0.946 |
| month-over-month % change | -14.8% | -73.9% | 263.1% | -9.9% | -31.5% | -9.2% | -4.8% | -7.2% | -3.4% | ||
| year-over-year % change | -44.4% | -81.4% | -34.6% | -21.6% | -42.9% | -52.5% | -26.2% | -29.9% | -28.9% | -32.9% | -52.5% |
| Libraries/Museums | 0.194 | 0.109 | 0.208 | 0.189 | 0.143 | 0.170 | 0.268 | 0.217 | 0.214 | 1.692 | 0.510 |
| month-over-month % change | 52.7% | -43.9% | 91.2% | 13.5% | -24.2% | 18.8% | -14.1% | -19.2% | -1.4% | ||
| year-over-year % change | -73.1% | -85.0% | -15.0% | -54.7% | -74.1% | -69.8% | -29.6% | -49.9% | -49.4% | 145.5% | -69.8% |
| Police/Courthouse/Prison | 0.922 | 0.488 | 0.507 | 0.900 | 0.707 | 0.639 | 0.672 | 0.676 | 0.663 | 2.035 | 1.917 |
| month-over-month % change | 29.5% | -47.1% | 4.0% | 12.4% | -21.4% | -9.6% | -0.1% | 0.6% | -1.9% | ||
| year-over-year % change | -1.2% | 10.2% | -23.0% | 32.8% | 12.6% | -5.8% | 9.7% | 8.4% | 4.0% | 54.5% | -5.8% |
| Military | 0.979 | 0.408 | 1.188 | 0.825 | 0.597 | 0.858 | 0.798 | 0.807 | 0.861 | 1.482 | 2.575 |
| month-over-month % change | 142.6% | -58.3% | 191.0% | -0.3% | -27.7% | 43.8% | 3.7% | 1.1% | 6.7% | ||
| year-over-year % change | 52.7% | 34.3% | 121.5% | 62.0% | 52.4% | 73.8% | 77.0% | 74.6% | 82.9% | 68.5% | 73.8% |
| Schools/Colleges | 3.976 | 3.888 | 3.804 | 3.819 | 3.688 | 3.890 | 5.507 | 5.495 | 5.195 | 16.204 | 11.669 |
| month-over-month % change | 24.2% | -2.2% | -2.2% | -1.2% | -3.4% | 5.5% | -1.2% | -0.2% | -5.5% | ||
| year-over-year % change | -16.5% | -3.7% | -48.6% | -21.2% | -21.8% | -28.0% | -12.1% | -11.9% | -18.1% | 1.6% | -28.0% |
| Misc Government | 0.390 | 0.490 | 0.407 | 0.587 | 0.551 | 0.429 | 0.635 | 0.636 | 0.571 | 2.248 | 1.287 |
| month-over-month % change | -49.4% | 25.7% | -17.1% | -8.2% | -6.3% | -22.1% | -2.5% | 0.2% | -10.2% | ||
| year-over-year % change | -33.6% | 3.8% | -65.8% | -5.2% | -12.1% | -42.8% | -14.4% | -16.0% | -29.1% | 16.3% | -42.8% |
| TOTAL INSTITUTIONAL | 7.667 | 6.709 | 10.293 | 7.948 | 6.976 | 8.223 | 9.594 | 9.472 | 9.367 | 29.504 | 24.669 |
| month-over-month % change | 17.0% | -12.5% | 53.4% | -2.7% | -12.2% | 17.9% | -1.8% | -1.3% | -1.1% | ||
| year-over-year % change | -21.5% | -17.9% | -10.9% | -19.5% | -24.8% | -16.4% | -14.1% | -16.0% | -17.4% | 5.3% | -16.4% |
| Misc Non Residential | 0.398 | 0.466 | 0.423 | 0.428 | 0.437 | 0.429 | 0.450 | 0.453 | 0.445 | 1.506 | 1.287 |
| month-over-month % change | -11.4% | 17.1% | -9.1% | -8.9% | 2.1% | -1.9% | -3.0% | 0.7% | -1.7% | ||
| year-over-year % change | -29.4% | 8.7% | -17.7% | -32.3% | -8.7% | -14.5% | -30.8% | -28.8% | -29.7% | -4.3% | -14.5% |
| TOTAL NONRES BUILDING | 14.943 | 12.205 | 20.282 | 15.915 | 13.211 | 15.810 | 19.407 | 18.670 | 18.653 | 65.445 | 47.430 |
| month-over-month % change | 19.7% | -18.3% | 66.2% | -8.1% | -17.0% | 19.7% | -3.7% | -3.8% | -0.1% | ||
| year-over-year % change | -37.5% | -42.0% | -1.0% | -35.8% | -40.6% | -27.5% | -32.2% | -35.4% | -33.6% | -8.2% | -27.5% |
| Airports | 0.128 | 0.176 | 0.180 | 0.315 | 0.155 | 0.162 | 0.501 | 0.500 | 0.466 | 0.931 | 0.485 |
| month-over-month % change | -20.3% | 37.4% | 2.1% | -25.2% | -50.7% | 4.1% | -0.5% | -0.3% | -6.6% | ||
| year-over-year % change | -17.5% | -10.5% | -68.9% | 0.7% | -41.0% | -47.9% | -14.6% | -8.4% | -17.8% | -38.6% | -47.9% |
| Roads/Highways | 3.532 | 3.550 | 5.419 | 4.072 | 3.465 | 4.167 | 5.264 | 5.256 | 5.243 | 13.159 | 12.502 |
| month-over-month % change | 6.7% | 0.5% | 52.6% | -10.7% | -14.9% | 20.3% | -0.6% | -0.1% | -0.2% | ||
| year-over-year % change | -10.3% | -2.6% | -2.8% | -0.5% | -13.2% | -5.0% | -3.6% | -3.8% | -4.5% | 4.6% | -5.0% |
| Bridges | 2.060 | 1.102 | 1.754 | 1.907 | 1.912 | 1.639 | 1.861 | 1.794 | 1.700 | 7.019 | 4.916 |
| month-over-month % change | -20.0% | -46.5% | 59.1% | 20.8% | 0.2% | -14.3% | -0.8% | -3.6% | -5.3% | ||
| year-over-year % change | -7.7% | -41.9% | -39.3% | -0.8% | -0.4% | -30.0% | -26.1% | -27.3% | -33.9% | 10.4% | -30.0% |
| Dams/Marine | 0.456 | 0.411 | 0.515 | 0.536 | 0.424 | 0.461 | 0.642 | 0.651 | 0.642 | 1.885 | 1.382 |
| month-over-month % change | 12.0% | -9.9% | 25.5% | -30.4% | -20.8% | 8.5% | -6.1% | 1.4% | -1.4% | ||
| year-over-year % change | -52.4% | 36.9% | -17.8% | -33.6% | -23.1% | -26.7% | -15.6% | -14.1% | -18.5% | 91.8% | -26.7% |
| Water/Sewage | 3.016 | 2.002 | 2.756 | 2.427 | 2.478 | 2.591 | 2.674 | 2.670 | 2.633 | 7.315 | 7.774 |
| month-over-month % change | 24.9% | -33.6% | 37.6% | 12.0% | 2.1% | 4.6% | 3.0% | -0.2% | -1.4% | ||
| year-over-year % change | 45.7% | -2.5% | -13.6% | -6.3% | 1.8% | 6.3% | 3.7% | 3.7% | -1.5% | 6.9% | 6.3% |
| Misc Civil | 4.642 | 0.686 | 1.324 | 2.432 | 2.203 | 2.217 | 1.957 | 1.932 | 1.905 | 5.682 | 6.652 |
| month-over-month % change | 262.1% | -85.2% | 93.1% | 100.6% | -9.4% | 0.6% | 7.3% | -1.3% | -1.4% | ||
| year-over-year % change | 52.0% | -30.1% | -19.6% | -39.0% | -39.2% | 17.1% | -51.6% | -52.2% | -52.6% | 57.6% | 17.1% |
| TOTAL ENGINEERING | 13.835 | 7.927 | 11.949 | 11.690 | 10.638 | 11.237 | 12.899 | 12.803 | 12.590 | 35.991 | 33.711 |
| month-over-month % change | 36.3% | -42.7% | 50.7% | 9.1% | -9.0% | 5.6% | 0.9% | -0.7% | -1.7% | ||
| year-over-year % change | 11.5% | -12.6% | -17.6% | -14.7% | -16.8% | -6.3% | -19.1% | -19.2% | -21.9% | 12.9% | -6.3% |
| GRAND TOTAL | 50.371 | 42.588 | 56.346 | 51.584 | 46.705 | 49.768 | 56.943 | 56.080 | 55.896 | 170.427 | 149.305 |
| month-over-month % change | 6.8% | -15.5% | 32.3% | -5.5% | -9.5% | 6.6% | -1.2% | -1.5% | -0.3% | ||
| year-over-year % change | -14.5% | -19.6% | -3.8% | -17.2% | -19.8% | -12.4% | -18.0% | -19.7% | -19.3% | 0.6% | -12.4% |
| NONRES BLDG + ENGINEERING | 28.777 | 20.132 | 32.231 | 27.605 | 23.849 | 27.047 | 32.306 | 31.473 | 31.243 | 101.436 | 81.141 |
| month-over-month % change | 27.1% | -30.0% | 60.1% | -1.5% | -13.6% | 13.4% | -1.9% | -2.6% | -0.7% | ||
| year-over-year % change | -20.8% | -33.2% | -7.9% | -28.3% | -31.9% | -20.0% | -27.5% | -29.6% | -29.3% | -1.7% | -20.0% |
Data Source and Table: ConstructConnect.
TABLE 9: U.S. YEAR-TO-DATE REGIONAL STARTS,
NONRESIDENTIAL CONSTRUCTION* — CONSTRUCTCONNECT
| JAN-mar 2020 | JAN-mar 2021 | % Change | |||
| Connecticut | $629,528,244 | $436,883,569 | -30.6% | ||
| Maine | $399,665,304 | $1,335,723,456 | 234.2% | ||
| Massachusetts | $2,071,213,365 | $1,425,066,119 | -31.2% | ||
| New Hampshire | $145,198,997 | $108,283,264 | -25.4% | ||
| Rhode Island | $188,252,027 | $409,762,193 | 117.7% | ||
| Vermont | $161,364,224 | $74,220,138 | -54.0% | ||
| Total New England | $3,595,222,161 | $3,789,938,739 | 5.4% | ||
| New Jersey | $2,102,968,230 | $982,893,433 | -53.3% | ||
| New York | $5,693,435,497 | $3,640,503,569 | -36.1% | ||
| Pennsylvania | $2,661,259,350 | $2,485,456,139 | -6.6% | ||
| Total Middle Atlantic | $10,457,663,077 | $7,108,853,141 | -32.0% | ||
| TOTAL NORTHEAST | $14,052,885,238 | $10,898,791,880 | -22.4% | ||
| Illinois | $2,906,111,475 | $2,571,915,181 | -11.5% | ||
| Indiana | $2,107,415,472 | $1,529,848,681 | -27.4% | ||
| Michigan | $1,707,025,085 | $1,830,456,583 | 7.2% | ||
| Ohio | $2,762,405,458 | $4,126,854,473 | 49.4% | ||
| Wisconsin | $1,842,499,682 | $1,335,249,151 | -27.5% | ||
| Total East North Central | $11,325,457,172 | $11,394,324,069 | 0.6% | ||
| Iowa | $1,226,004,300 | $868,347,632 | -29.2% | ||
| Kansas | $1,172,318,262 | $702,916,927 | -40.0% | ||
| Minnesota | $1,706,886,421 | $3,353,798,791 | 96.5% | ||
| Missouri | $2,328,512,441 | $1,782,954,148 | -23.4% | ||
| Nebraska | $1,796,701,077 | $590,755,710 | -67.1% | ||
| North Dakota | $232,362,467 | $461,345,385 | 98.5% | ||
| South Dakota | $267,536,848 | $399,790,357 | 49.4% | ||
| Total West North Central | $8,730,321,816 | $8,159,908,950 | -6.5% | ||
| TOTAL MIDWEST | $20,055,778,988 | $19,554,233,019 | -2.5% | ||
| Delaware | $590,030,316 | $314,577,650 | -46.7% | ||
| District of Columbia | $237,059,291 | $247,192,092 | 4.3% | ||
| Florida | $6,469,243,646 | $4,816,921,643 | -25.5% | ||
| Georgia | $3,718,363,570 | $3,388,558,746 | -8.9% | ||
| Maryland | $2,139,583,169 | $625,138,208 | -70.8% | ||
| North Carolina | $2,410,697,079 | $2,389,468,122 | -0.9% | ||
| South Carolina | $1,367,602,877 | $1,547,145,327 | 13.1% | ||
| Virginia | $3,616,205,989 | $2,283,192,217 | -36.9% | ||
| West Virginia | $508,936,275 | $225,997,094 | -55.6% | ||
| Total South Atlantic | $21,057,722,212 | $15,838,191,099 | -24.8% | ||
| Alabama | $1,643,613,092 | $1,285,017,182 | -21.8% | ||
| Kentucky | $856,646,660 | $743,707,704 | -13.2% | ||
| Mississippi | $957,383,069 | $353,176,950 | -63.1% | ||
| Tennessee | $2,660,624,948 | $3,636,358,370 | 36.7% | ||
| Total East South Central | $6,118,267,769 | $6,018,260,206 | -1.6% | ||
| Arkansas | $1,525,235,848 | $480,356,775 | -68.5% | ||
| Louisiana | $1,427,752,136 | $1,031,364,788 | -27.8% | ||
| Oklahoma | $1,024,423,396 | $920,225,846 | -10.2% | ||
| Texas | $10,631,078,217 | $10,416,889,209 | -2.0% | ||
| Total West South Central | $14,608,489,597 | $12,848,836,618 | -12.0% | ||
| TOTAL SOUTH | $41,784,479,578 | $34,705,287,923 | -16.9% | ||
| Arizona | $3,757,713,647 | $1,045,093,014 | -72.2% | ||
| Colorado | $2,140,035,603 | $1,352,366,466 | -36.8% | ||
| Idaho | $383,127,515 | $167,174,394 | -56.4% | ||
| Montana | $322,025,956 | $178,331,276 | -44.6% | ||
| Nevada | $1,108,992,354 | $663,675,317 | -40.2% | ||
| New Mexico | $394,986,172 | $557,631,896 | 41.2% | ||
| Utah | $2,751,228,987 | $862,272,742 | -68.7% | ||
| Wyoming | $256,831,848 | $192,489,697 | -25.1% | ||
| Total Mountain | $11,114,942,082 | $5,019,034,802 | -54.8% | ||
| Alaska | $230,451,444 | $168,353,939 | -26.9% | ||
| California | $10,424,479,133 | $7,997,893,211 | -23.3% | ||
| Hawaii | $220,884,657 | $414,982,369 | 87.9% | ||
| Oregon | $771,258,332 | $793,173,917 | 2.8% | ||
| Washington | $2,780,487,186 | $1,588,773,234 | -42.9% | ||
| Total Pacific | $14,427,560,752 | $10,963,176,670 | -24.0% | ||
| TOTAL WEST | $25,542,502,834 | $15,982,211,472 | -37.4% | ||
| TOTAL U.S. | $101,435,646,638 | $81,140,524,294 | -20.0% |
*Figures above are comprised of nonres building and engineering (i.e., residential is omitted).
Data Source and Table: ConstructConnect.