March’s Nonresidential Construction Starts +32% M/M, -8% Y/Y; +1% YTD
Megaprojects Slow to Kick In ConstructConnect announced today that March 2022’s volume of construction starts, […]
Megaprojects Slow to Kick In
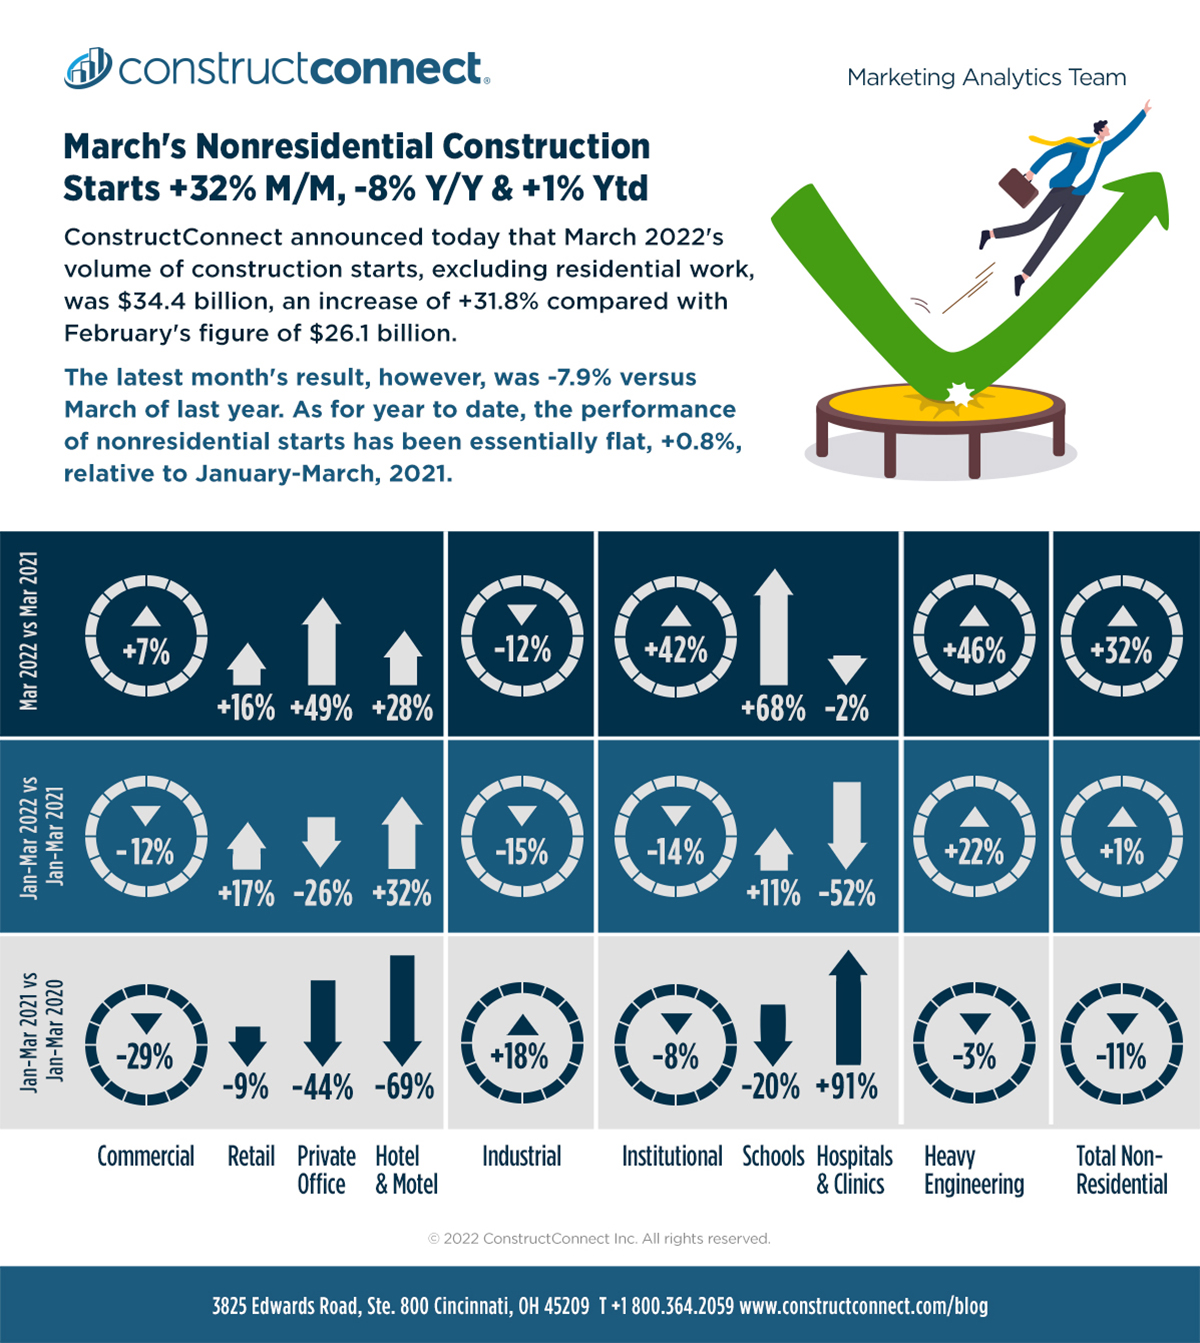
ConstructConnect announced today that March 2022’s volume of construction starts, excluding residential work, was $34.4 billion, an increase of +31.8% compared with February’s figure of $26.1 billion (previously reported as $25.7 billion).
The latest month’s result, however, was -7.9% versus March of last year. As for year-to-date, the performance of nonresidential starts has been flat, +0.8%, relative to January-March 2021.
View this information as an infographic.
Click here to download the complete Construction Industry Snapshot Package – March 2022 PDF.
In the latest month, there were no mega-sized project start-ups. (A ‘mega’ carries an estimated value of a billion dollars or more). In fact, the largest project appearing among the Top 10 carries an estimated value of less than half a billion dollars. This year’s Top 10 list includes three roadway projects, two medical facilities, and two manufacturing plants
The dearth of megaprojects in the latest month is quite a departure from March of last year when there were three ultra-big projects totaling $4.8 billion. Last March’s three billion-dollar-plus groundbreakings included two hospitals and an auto assembly plant expansion
There’s an impressive array of huge projects in the planning stage. Almost certainly upcoming are billions of dollars to be spent on auto plants to produce EVs, and on new battery-making plants, plus computer chip facilities, and additions to steelmaking capacity. Furthermore, much of this work is not optional. It will need to proceed for the major corporations behind these plans to achieve, by 2030-2035, the net-zero polluting goals they have set for themselves.
Plus, there will soon be major project undertakings, primarily in the engineering construction field, to flow from financing allocated in the Infrastructure Investment and Jobs Act (IIJA).
GRAND TOTAL starts in March 2022 (i.e., adding residential to nonresidential activity) were +25.6% m/m, -3.1% y/y, and +4.1% ytd.
Across the Board M/M Strength
There are three major subcategories of total starts: residential, nonresidential building, and heavy engineering/civil. On a year-to-date basis in March 2022, engineering starts were strongest at +21.9%; residential starts were also up, but to a lesser extent, +7.7%; and nonresidential building starts dragged their feet, -12.5%.
On a month-to-month basis in March, though, all three subcategories were winners, with engineering at the forefront, +45.5%. Nonresidential building and residential were approximately half as robust as engineering, at +21.2% and +19.6% respectively.
Softening in Y/Y Trailing 12-Month Starts Stats
Other statistics often beloved by analysts are trailing twelve-month (TTM) results and these are set out for all the various type-of-structure categories in Table 10.
Grand Total TTM starts in March 2022 on a month-to-month basis were -0.3%, which was a reversal in course from February’s +0.7% and January’s +0.4%.
On a year-over-year basis in March 2022, GT TTM starts were +9.1%, a slowdown from February’s +11.0%, and about on a par with January’s +9.3%.
Res-to-Nonres Relationship Stays Half-and-Half in PIP Numbers
Starts compile the total estimated dollar value and square footage of all projects on which ground is broken in any given month. They lead, by nine months to as much as two years, put-in-place (PIP) statistics which are analogous to work-in-progress payments as the building of structures proceeds to completion.
PIP numbers cover the universe of construction, new plus all manner of renovation activity, with residential traditionally making up two-fifths (about 40%) of the total and nonresidential, three-fifths (i.e., the bigger portion, at around 60%).
Over the course of the pandemic, though, the mix has undergone a profound shift. In 2021’s full-year PIP results, the residential to nonresidential relationship was approximately half and half. And that relationship, on a not seasonally adjusted (NSA) basis, was maintained in February of this year, with residential being 49.3% of the total and nonresidential, 50.7%. (Nonresidential is nonresidential buildings plus engineering). February is the latest available month for PIP stats.
The January-February 2022 over January-February 2021 total dollar volume of PIP construction was +10.4%, with residential being +15.5% and nonresidential, +5.8%. Moving deeper into 2022, the expectation is that burgeoning nonresidential activity will eliminate the gap with a less frenetic residential.
PIP numbers, being more spread out, have smaller peak-over-trough percent-change amplitudes than the starts series. As an additional valuable service for clients and powered by its extensive starts database, ConstructConnect, in partnership with Oxford Economics, a world leader in econometric modeling, has developed put-in-place construction statistics by types of structure for U.S. states, cities, and counties, actuals, and forecasts. ConstructConnect’s PIP numbers are being released quarterly and are featured in a separate reporting system.
Construction Employment Attains Milestone in March
Construction’s share of total nonfarm employment in the monthly Employment Situation report is a little over 5%. To match March’s total job-count increase of +431,000, the figure for construction would have needed to be +22,000. The actual gain, at +19,000, wasn’t far off the mark. Half the climb in construction jobs occurred at the level of residential subcontractor trades.
The not seasonally adjusted unemployment rate for all jobs in March was 3.8%. For construction as a subset of all jobs, the NSA U rate was 6.0%. The 6.0% was an improvement on the 6.7% recorded in February and it was much better than March 2021’s 8.6%.
Construction reached a milestone in the latest month not yet realized by all jobs. Construction’s total level of employment climbed slightly above where it was in February 2020, before the coronavirus devastated job counts throughout almost all sectors of the economy. Construction’s jobs ‘claw back’ ratio, versus February-April 2020’s huge loss, is now 100.4%. For all jobs in the economy, the recovery ratio still falls short by a rung or two, at 92.8%.
The total jobs count in the nation is currently +4.5% year over year; for construction, it’s +3.0%. In other segments of the economy with close ties to construction, the latest y/y percentage changes in employment are: machinery and equipment rental and leasing, +10.7%; oil and gas exploration and extraction, +10.2%; architectural and engineering design services, +6.0%; cement and concrete product manufacturing, +4.8%; real estate, +4.7%; and building materials and supplies dealers, -1.5% (although their retail sales are +16.0% y/y, both SA and NSA).
Pluses and Minuses Among the Type of Structure Subcategories
March 2022’s +31.8% month-to-month (m/m) increase in total nonresidential starts originated mainly in the engineering (+45.5%) and institutional subcategories (+42.0%), with commercial (+6.6%) throwing in a little help as well. Only industrial (-12.0%) moved into arrears.
The -7.9% performance of total nonresidential starts in March of this year versus March of last year resulted from big dips in industrial (-58.4%), commercial (-28.9%), and institutional (-18.0%) that overwhelmed engineering’s quite decent gain (+29.0%).
As for March’s year-to-date record of ‘no change’ (+0.8%), it relied on a boost in engineering (+21.9%) to fend off almost equal setbacks in industrial (-14.5%), institutional (-13.5%), and commercial (-11.6%).
There are two dominant subcategories of total nonresidential starts. When the volumes of roads/highways and schools/colleges are added together, they accounted for more than one-third of total year-to-date nonresidential activity in March 2022 (i.e., shares of 21.0% and 16.0% respectively, summing to 37.0%).
The three percentage-change metrics for street starts in March 2022 were outstanding, +49.6% m/m, +36.0% y/y and +45.9% YTD. For school starts, the m/m change was wonderful, +67.6%, but y/y and ytd weren’t as spectacular, +25.0% and +11.3% respectively. By the way, there was a similar pattern for water/sewage starts: +69.4% m/m, but +34.7% y/y and +13.4% YTD.
For the three medical subcategories combined, i.e., hospital/clinic, nursing/assisted living, and miscellaneous medical, March 2022’s starts were disappointing, -9.9% m/m, -60.8% y/y, and -39.2% YTD. Hospital/clinic starts on their own were -51.7% YTD.
Among commercial starts in March, the hotel/motel and retail/shopping subcategories are surprisingly upbeat year to date, +31.6% and +17.0% respectively. Private office buildings and warehouses, though, are struggling year to date, -26.0% and -39.8% respectively.
JOLTS Provides Jolt to Wages
For ease of viewing, Graphs 5 and 6 show smoothed curves (i.e., based on three-month moving averages) for the Job Openings and Labor Turnover Survey (JOLTS) results pertaining to vacant positions and hires.
Openings in the construction industry remain extremely elevated. Both as a level and a rate, they are near their all-time peaks. But that’s not translating to much in the way of ‘hires’, according to the JOLTS numbers. Not only have hires, as a level and rate, been low recently relative to earlier this century, but they also have the unfortunate habit of following an uptick with a dip.
Employers in sectors throughout the economy are grappling with shortages of workers to fill vacant positions. One side effect has been substantial increases in compensation rates.
Trend Graphs Offer Up Mixed Bag of Results
This Industry Snapshot showcases a dozen type-of-structure trend graphs. The trends are captured by taking 12-month moving averages of ConstructConnect’s starts statistics.
Interestingly, the retail trend line appears to have bottomed out and to be moving sideways. The private office building trend line is still sinking. There’s a slight uptick in schools/colleges, but it’s counterbalanced by a downturn in hospitals/clinics.
Roads/highways is the one clear champion, with a strikingly ascending curve, although water/sewage is also moving higher, but at a more relaxed pace. Miscellaneous civil and bridges are waiting for the big injections of infrastructure spending under the IIJA to regain their former growth momentum.
Solid, but Not Excessive, Advances in Construction Wages
Tables B-3 and B-8 of the monthly Employment Situation report, from the BLS, record average hourly and average weekly wages for industry sectors. B-3 is for all employees (i.e., including bosses) on nonfarm payrolls. B-8 is for production and nonsupervisory personnel only (i.e., it excludes bosses). For all jobs and construction, there are eight relevant percentage changes to consider.
From March 2022’s Table B-3 (including bosses), year-over-year all-jobs earnings were +5.6% hourly and +4.6% weekly. The pay packages of construction workers were in the same ballpark, +5.7% hourly, and +4.1% weekly. From Table B-8 for production and non-supervisory workers (i.e., excluding bosses), the all-jobs compensation gains were +6.7% hourly and +5.8% weekly. Construction workers weren’t far behind hourly, +6.2%, but were a step back weekly, +4.6%.
Breakneck Y/Y Material Cost Increases
March’s y/y results for three building-related BLS Producer Price Index series were: (A) construction materials special index, +24.5% (significantly down from February’s +29.6%); (B) inputs to new construction index, excluding capital investment, labor, and imports, +21.5% (nearly the same as the previous month’s +21.4%); and (C) final demand construction, designed to capture bid prices, +16.7% (a small advance from February’s +16.4%).
(A) comes from a data series with a long history, but it’s confined to a limited number of major construction materials. (B) has a shorter history, but it’s more comprehensive in its coverage, although it includes some items (e.g., transportation) that aren’t strictly materials.
Concerning the cost of some major construction material inputs, as revealed in the PPI data set published by the BLS, diesel fuel is +63.8% y/y; hot rolled steel bars, plates, and structural shapes, +45.4%; aluminum sheet and strip, +45.1%; asphalt, +36.9%; softwood lumber, +22.9%; gypsum, +20.7%; copper wire and cable, +15.8%; cement, +8.2%; and ready-mix concrete, +7.1%.
Earlier in this report, mention was made of bullish highway and street construction starts. Know also, though, that there’s a unique inputs to highways and streets PPI index and it’s +21.0% y/y.
The value of construction starts each month is derived from ConstructConnect’s database of all active construction projects in the United States. Missing project values are estimated with the help of RSMeans’ building cost models. ConstructConnect’s nonresidential construction starts series, because it is comprised of total-value estimates for individual projects, some of which are super-large, have a history of being more volatile than many other leading indicators for the economy.
March 2022’s Grand Total Starts +4.1% YTD
ConstructConnect’s total residential starts in March 2022 were +19.6% m/m, +2.7% y/y and +7.7% YTD. Multi-family starts in March were +0.7% m/m, -10.3% y/y and +0.6% ytd. Single-family starts were +26.3% m/m, +7.1% y/y and +10.5% YTD.
Including home building with all nonresidential categories, Grand Total starts in March 2022 were +25.6% m/m, -3.1% y/y, and +4.1% YTD.
ConstructConnect adopts a research-assigned ‘start’ date. In concept, a start is equivalent to ground being broken for a project to proceed. If work is abandoned or rebid, the start date is revised to reflect the new information.
Risk of Recession
The tailwinds supporting construction spending cannot be denied. The infrastructure needed to address North America’s civil and commercial market shortcomings provide a multitude of reasons to be optimistic about the near to mid-term building outlook. However, these segments of the economy constitute less than a third of all national output with the remainder generated by consumer spending. It’s unfortunate the outlook for this segment of GDP is not as sanguine.
Many of the headwinds that will slow consumer spending are the natural consequence of the more than $5 trillion U.S. government-backed spending spree begun two years ago. The financial sugar rush came at a time when companies were least able to absorb the extra spending as they grappled with disrupted supply chains and a significant contraction in the labor force.
This imbalance of supply and demand has resulted in prices increases that are outpacing wages. U.S. inflation-adjusted disposable personal income has fallen month-on-month in 10 of the last 11 months (ending February 2022), according to the Bureau of Economic Analysis. Rising interest rates, coupled with the return of student debt and home mortgage payment obligations, will generate further significant obstacles that could see consumer spending fall substantially and send the overall economy into a recession.
Expansion Index Monitors Construction Prospects
The economy may be in recovery mode, but nonresidential work is usually a lagging player. Companies are hesitant to undertake capital spending until their personnel needs are rapidly expanding and their office square footage or plant footprints are straining capacity. Also, it helps if profits are abundant. (Today’s greater tendency to work from home has made office occupancy much more difficult to assess.)
Each month, ConstructConnect publishes information on upcoming construction projects at its Expansion Index.
The Expansion Index, for hundreds of cities in the United States and Canada, calculates the ratio, based on dollar volume, of projects in the planning stage, at present, divided by the comparable figure a year ago. The ratio moves above 1.0 when there is currently a larger dollar volume of construction ‘prospects’ than there was last year at the same time. The ratio sinks below 1.0 when the opposite is the case. The results are set out in interactive maps for both countries.
Click here to download the Construction Industry Snapshot Package – March 2022 PDF.
Click here for the Top 10 Project Starts in the U.S. – March 2022.
Click here for the Nonresidential Construction Starts Trend Graphs – March 2022.
Specifically, it breaks nonresidential building into ICI work (i.e., industrial, commercial, and institutional), since each has its own set of economic and demographic drivers. Table 3 presents an alternative, perhaps more user-friendly and intuitive type-of-structure ordering that matches how the data appears in ConstructConnect Insight.
Data Source and Table: ConstructConnect.